Sunday, May 29, 2016

First jet-controlled stabilization

A milestone day: The first controlled rotations for the HAPP test apparatus! (clap, clap, clap)

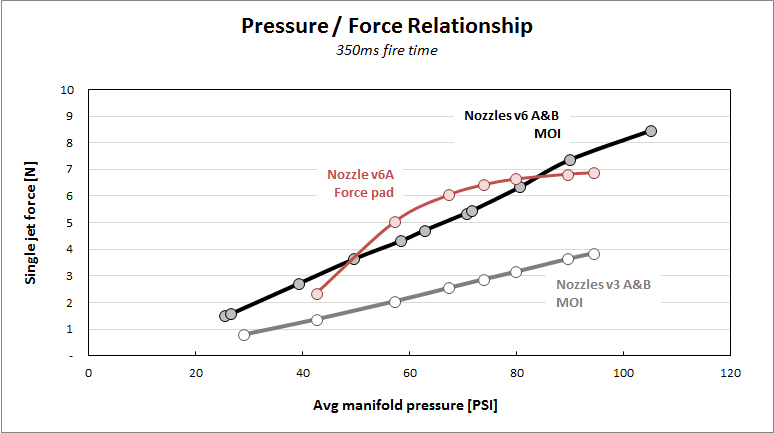
At this point all the fundamental building blocks have come together. We have some 3D-printed jet nozzles attached to a pneumatic valve system that's controlled by an on-bard IMU. We developed a method to measure the moment of inertia quite accurately, and then we used the MOI to back-calculate the actual jet force. Furthermore, we were able to describe jet force as a mathematical function of manifold pressure, which we can measure in real time to account for regulator droop or other issues (such as multiple jets firing at once).

The HAPP apparatus at this point doesn't look much like the flight hardware we'll actually use in the future. Right now the apparatus is a jumble of plywood, cardboard, hot glue, tie straps, and a mess of wires and tubes. It only has arms and jets for a single axis (yaw). The only parts that are potential flight hardware are the Arduino controller and IMU, the carbon fiber jet arms and the 90 cubic inch carbon fiber compressed gas tank rated to 4600 PSI (normally used for paint ball!). However, it's all running on independent battery power and gas pressure - no connections to the outside world. Here's the test rig in all its sloppy glory:


Ugly but functional!

I don't even have 4 nozzles of the same design to use as the plus and minus jets on the yaw axis. All I've got are two each of designs v3 and v6. That's OK - the controller doesn't care as long as it knows the pressure / force curve for each one. Despite all this, I simply couldn't wait to hook everything up and watch the system control its own rotations.

So, without further delay, here's a video of the very first controlled rotations. It starts with me spinning the rig by hand. After a 6 second delay, the controller (a.k.a the autopilot) nulls out the rotation and simply sits on the current heading. It doesn't try to return the rig to a pre-set heading - I'm just keeping it simple for the first tests until I can tune the controller more finely. After the jets stop the rotation, I bump the rig in both directions, and you can see the jets null out the induced motion. Finally, I give it a good spin, and the system stops itself in a matter of seconds.

There are many months of hard work ahead on this project, but as of today I can say one thing - this is going to work! Enjoy the video and leave me some comments :-)


Saturday, May 28, 2016

Dynamic test fire: Jet force and pressure relationship

Now that we've nailed down the moment of inertia using two different methods, it's time to verify the jet force as accurately as possible. And we don't just need a single number; we need to characterize the jet force as a function of gas pressure supplied to the 3D-printed nozzles. The pendulum-based method we're using now gives a way to double-check the force/pressure relationship measured earlier by the force-sensitive resistor pads on the static test fire stand. The pads were difficult to calibrate and I suspected the data was pretty sloppy.

First we need to make a quick conversion of the trifilar pendulum apparatus. The pendulum only oscillates back and forth; it cannot rotate through large angles, and it certainly can't spin around completely. In the test firing we're about to do, the HAPP needs to rotate freely with minimal resistance.

I replaced the pendulum's three perpendicular suspension lines with a 3-stranded bundle of 20-pound braided monofilament hung from the center of the pendulum support. The entire weight of the test rig can hang from this single bundle and spin quite easily. However, the test platform also needs to stay level, so I used three single monofilament lines to create a hanging basket "tripod" that attaches to the end of the central bundle. I also kept the digital scales in-line to provide continuing validation that the rig is properly balanced.


Ready to spin

Next I programmed the on-board Arduino to fire the jets for a short interval (350 milliseconds) and measure (1) the angular acceleration using the IMU chipset; and (2) the manifold pressure using the pressure transducer. Knowing acceleration and the moment of inertia, we can back-solve for jet force using Newton's Second Law for rotations (or Euler's equation if you prefer). Knowing the instantaneous pressure, we can also quantify the relationship between pressure and force.

Results:

As expected, the results were much more robust than those from the force-sensitive resistor. Although we saw some instantaneous force pad readings over 8 newtons, after a careful (3rd-degree polynomial) curve fit, the true pressure / force relationship measured by the pads is shown by the red line below. According to the jet nozzle math - thank you, thermodynamics - the relationship should be almost linear. Clearly, the force pads exhibit a pronounced non-linearity, despite my best attempts to calibrate around the non-linear response.

The black and grey lines, on the other hand, show the pressure / force relationship from our new and improved method based on measurement of the moment of inertia. I think this is some impressively clean data given that we're basically dealing with a lab apparatus made of plywood and fishing line!

The black line is for the nozzles v6 A&B, where A&B denote two copies of the same design. The design intent for v6 was 11N thrust at 100 PSI. AT 100 PSI we're seeing 8.04N thrust, which is 73% of design intent.

The grey line is for the nozzles v3 A&B. The design intent for v3 was 7.5N thrust at 100 PSI. At 100 PSI we're seeing 4.12N thrust, which is 55% of design intent.


Why is the force lower than design intent? I think there are two answers. First, for v6, the design intent really challenges the solenoid valve used for these tests. The valve has a flow coefficient of Cv = 0.65, which is right at the edge of the 0.64 required by the nozzle math. Any negative variance around the nominal 0.65 means the valve is not supplying all the air that the nozzle can take, and force would be lower as a result. I think this is very likely as the valve is a cheap consumer model.

Second, the specific 3D printer we used for the nozzles has a worst-case dimensional tolerance of +/- 0.2mm. Therefore, the nozzle throats could be up to 12% smaller than designed. This would reduce the mass flow and therefore the jet force.

These two factors could easily explain the failure to achieve the force as per design intent. The good news is, it doesn't really matter! What we really need is an accurate characterization of the pressure / force relationship for each nozzle, which we've clearly got from the graph above. We can plug the equation for those lines (as determined by linear regression) directly into the controller software. It's like a golfer with a perpetual slice - if the slice is perfectly repeatable, that golfer can win championships. He'll always know exactly where the ball will go.

There's another piece of good news I learned from this exercise. My original design intent of 11N or even 7.5N was excessive. We don't need that strong of a jet force. At more than a few newtons the jets spun the test apparatus violently - too violently if you're trying to take nice smooth video. That implies a few things:

  • We can fly the HAPP with manifold pressures well below 100 PSI, possibly in the range of 40-50 PSI. 
  • We can therefore adopt the amazingly lightweight and fast-response Festo MHJ series valves. These valves also have integrated relays, so we can eliminate a separate electronics board.

Why did I over-estimate the necessary jet force by a factor of 2 or 3? Because my original guess of the HAPP's moment of inertia (before anything was designed or built) was way too high. I told you in a previous post that I had very little feel for MOI, and I wasn't lying!

Next: A big milestone.... the first controlled rotations. Cool video coming up!


Friday, May 27, 2016

Who are my readers?

Quick detour:

I just checked the blog stats to see if anyone's been reading. Whoever you are, you don't leave many comments or +1s, so I figured I was talking to a vacuum (no problem, I can take it!).

Well, somewhat to my surprise, I've had 9,449 readers this week. I thought I'd show you the stats for reader geographies:


In honor of the Pakistanis taking the top spot, here's a song by the Pakistani group Strings. Yes, it was actually used in Spiderman 2...


Also FYI: Top platform was Android with 57% and top browser was Chrome with 59%.

Come on guys, leave some comments - don't be shy :-)

Thursday, May 26, 2016

Measuring moment of inertia - Two methods

In the last post I described the trifilar pendulum apparatus for measuring moment of inertia (MOI). The controls software requires MOI as an input parameter so it can calculate the phase plane trajectories. Without knowing the MOI, the flight control computer won't know how much the jets will cause the HAPP to rotate - the jets would be "firing blind" so to speak.

I also explained that once we know the MOI, we can solve backwards and find the jet force produced by the 3D-printed nozzles. This may be more accurate than the jet force measurements we did with the force-sensitive resistor pads on the static test fire stand. An accurate value for jet force is also required by the control system.

So how'd it go?

Using the Arduino-based IMU sensor package and software sketch I developed, it was easy to identify the period of oscillation for the prototype HAPP hardware loaded onto the pendulum platform: 2016 milliseconds. Using this period, and plugging in the physical dimensions of the test setup, I got a moment of inertia around the z-axis (J_zz) of 0.1815 kg-m^2. Stepping carefully through the various measurements I calculated a margin of error of +/- 0.9%. That's pretty tight, and it validates my guess that we could get error percentages in the low single digits.

Personally, I don't have a good "feel" for moment of inertia. Answer quickly: Within a factor of 10 (or even 100), what's the J_zz of a typical passenger car? Couldn't tell you unless I looked it up. Similarly, it's hard for me to see the number 0.1815 kg-m^2 and judge if it's even approximately correct. Can we validate it with another method? It doesn't need to be super-accurate - within 20% or 30% would be fine - just close enough that we know the trifilar pendulum method is more or less correct.

Meet Mr. Rubber Band. From Hooke's Law we know that the pulling force exerted by this band will be more or less proportional to how far it's been stretched. I used one of the trifilar pendulum's hanging scales and measured pull force for different amounts of stretch to obtain the following relationship. The black line is data and the red line is a linear fit - pretty tidy for some rough data.


Now we have a known force that we can apply tangentially to the HAPP arm as shown in the picture below. By measuring the resulting acceleration with our on-board IMU instrumentation, and then applying our old friend the Euler equation for rotations, we can back-solve for J_zz, the moment of inertia.


The HAPP project utilizes only the most
sophisticated technologies: Cardboard box,
millimeter scale, and an old rubber band.
Nozzle v6 points left and v3 points right.

I expected this method to be fairly sloppy, but after several trials, the average J_zz measured by Mr. Rubber Band's test was 0.1839 kg-m^2. That's only a 1.4% difference versus the nominal value from the elaborate trifilar pendulum method! Conclusions:
  1. The pendulum method is good.
  2. The pendulum method was a lot of work that wasn't really necessary!
  3. I never would have believed the rubber band results if that's all I had, so perhaps the pendulum wasn't a total waste of time :-)
Of course we'll have to come back and measure J_zz again once the HAPP has been fully constructed. We'll also need to measure moments of inertia along the other two principle axes, as well as the three cross-axis products of inertia, thereby filling out the inertia tensor. But at least we've validated the trifilar pendulum method pretty thoroughly.

Next post: Characterizing the relationship between jet force and manifold pressure.

Monday, May 16, 2016

Trifilar pendulum to find moment of inertia

"Trifilar pendulum." Just saying the words, you know this is going to be a lot of fun...

Previously I talked about needing a better test apparatus to measure the jet force from our 3D-printed nozzles. In this post I'll explain the theory behind the apparatus and show how I built the thing.

The first goal is to accurately characterize jet force, which turned out to be hard to measure directly using the force-sensitive resistor pads.

The second goal is to develop a method for measuring the components of the HAPP's inertia tensor. Eventually we will need to to measure the finished HAPP and enter the values as parameters into the controls software I developed previously. The software needs the tensor to calculate phase plane trajectories.

Both goals can be accomplished with the same apparatus. It's a pendulum, but it's a special one with 3 strings called a trifilar pendulum. This pendulum does not swing back and forth; rather, it rotates first in one direction and then the other, back and forth periodically - you'll see what I mean in the video below. Car companies and aircraft designers use giant trifilar pendulums to measure the inertia tensor for entire motor cars and airplanes (see this paper from NACA in 1948 - the precursor to NASA). Something similar is done for golf clubs as well.

A trifilar pendulum has the useful property that the period T and the moment of inertia I around the rotation axis are related like this:


where g is the gravitational constant, L is the suspension string length, and r is the platform radius (which equals the support radius). The derivation of this formula is not only fun, but also a good refresher of freshman physics. Check out a straightforward derivation here and a more elaborate setup here.

Now the moment of inertia I is a combination of I from the pendulum platform itself, plus additional I from whatever is placed on the platform, so


and the mass m is likewise a combination of the two.

Once we have all other variables we can solve for I of the HAPP or whatever object we place on the platform. That accomplishes the second objective, and we'll be coming back to this in the future once the HAPP is built up.

What about the first objective? Once we know I, we can use an important formula called Euler's rotation equation:


where all the variables are in bold type to denote multi-dimensional vectors. H is angular momentum, ω is angular velocity, and I is the inertia tensor which contains the three moments and three products of inertia. Dots over variables indicate derivatives with respect to time (d/dt).

What does Euler's formula say? Well, dH/dt = I(dω/dt) is just the rotational version of Newton's Second Law, F = ma. Instead of linear force we now have a change in angular momentum or a torque, which is supplied by the jets firing. But we're rotating, and potentially around multiple axes simultaneously. The rotation around one axis can "drag" the body away from simple rotation around another axis. That's what the Ï‰ Xterm does. It's the main difference with simple linear motion.

To make use of all this for our first objective, start with the pendulum and payload, including the compressed gas tank, regulators, valves, controls, nozzles, and any other necessary bits to fire the jets. Measure I as above. Place the pendulum & payload at rest without any oscillation. Fire the jets for a short interval. The jets supply a torque equal to the jet force times the moment arm, which is the distance from the jet nozzle to the HAPP's center of rotation.

At the end of that interval measure angular velocity Ï‰. Since we now know Iω, and dω/dt, and we can directly measure the moment arm, we therefore can solve for the jet force. With a little luck, our jet force measurements should be more accurate and repeatable than the previous attempt with force sensitive resistance pads. Simple!

So let's build it.

Here's the full view of the trifilar pendulum I constructed. It's almost 10 feet from floor to ceiling joists. The pendulum platform (bottom) and support (top) are 1/2" plywood and the support is screwed into the ceiling joists. Suspension is 10-lb braided monofilament (braided to minimize stretch) attached to threaded eyelets. Radius of platform and support are 29cm from center to holes for suspension eyelets.


Circularity of platform and support was achieved through some high-tech rocket science - a paint stirrer used as a protractor, with a nail pivot in one end and a hole for a pencil in the other.


True rocket science

I also strung some digital scales in-line with the suspension to facilitate the initial setup and also to verify that the payload is loaded with its center of mass on the center of the platform. If everything is centered and level, the scales will all show the same reading.


In-line digital scale, 1 of 3

As it's difficult to tie hitch knots onto the eyelets while ensuring the platform is perfectly level, I tied a sliding hitch and then improvised a crimp using an M4 bolt, nut, and washers. This allowed me to slide the hitch knots up and down until the platform was level and then crimp them off to prevent further motion.


Suspension crimp

Nice and level. The pendulum platform.

When finished, the whole trifilar pendulum oscillates like so:


Terrific. Now how do we measure angular velocity and acceleration? There are many creative methods on the web such as this, but few of them have the high accuracy we require. Fortunately I happened to have some IMU chipsets for the controls system. These IMUs have on-board gyros and accelerometers. So my idea was to build up an Arduino with an IMU, include it in the payload on the pendulum platform, and have it log the data for analysis. As the primary IMU I used for the controls system was already integrated with another Arduino, I used this (link) one which is even smaller - it's the thumbnail-sized black board with the red light at lower left.


IMU, data logger, web server, WiFi.
Plus an audible buzzer and a status LED.


This Arduino is also using a shield that's a combination WiFi / micro SD card reader. To make things easy, I programmed the Arduino to identify inflection points in the oscillation (where it changes direction) and automatically calculate the oscillation period. It logs all the data to the micro SD card for any future analysis and then sets up a small web server. The on-board web server can send the summary data including the oscillation period to the browser on my iPhone as I run the tests. No need to run back and forth between my computer and the test rig.

This IMU was quite a bit noisier than the Bosch BNO055 I used for the HAPP flight controller as it lacks the Bosch's data fusion mode and therefore tends to drift. This made automatic identification of the inflection points a little challenging. After trying out a few algorithms I finally developed one that gives results like this:


The red spikes show the auto-ID'd inflection points for one of the data traces. The black trace is for an empty pendulum platform containing only the Arduino. For the grey trace I loaded a few small, 79-gram weights on the platform's outer rim to increase the moment of inertia slightly. As you can see, the test apparatus can readily distinguish the two cases, and the software identifies the two different periods (see legend). I'm logging data samples to the SD card at 500Hz (the Arduino does not have enough memory to buffer all the data to RAM) so the system has resolution down to 2 microseconds. This is 5 to 10 times better than measurement systems I've seen in other projects.


Empty platform (left) and loaded with small weights (right)

As a final comment on the apparatus, I can say that the choice of components resulted in a pendulum with very low damping. Once started it will oscillate for a long time. Here's a trace showing 10 minutes of "ring-down." Motion was still visible even after 30 minutes. This is a very lightly damped system - so light that the effects of damping on the oscillation period will be less that other sources of error. The measured damping ratio is only 7.2x10^-07. I'll spare you the math on how I got that one :-)


This post turned out longer than I expected, so I'll save the jet force results for the next post.

Tuesday, May 10, 2016

Static test fire: Results and limitations


At last it's fire time.

I set up the static test fire stand as described in my earlier post. With the Arduino-based data acquisition system thoroughly validated, I was ready to rock.

Round 1

For the first tests I used the v3 nozzle and the Festo MHJ series solenoid valve specified earlier. The v3 nozzle has a design intent of 7 newtons of force given a 100 PSI air supply at sea level.

The first step was to calibrate the force sensitive resistor pad as discussed here. Calibration consists of loading the pad with a series of known test masses and recording the voltages read by the Arduino analog read pin. With a little curve fitting and conversion from test masses (grams) to force (newtons) we get a mathematical relationship between voltage readings and force. Note that the test masses are loaded coaxially with the jet exhaust. Note also that the whole stack of test masses is pretty unstable and rather tricky to balance. This undoubtedly contributes to inconsistent distribution of the load across the resistor pad and adversely influences the calibration.


Test masses for calibration, nozzle v3.
Additional test masses (nuts & bolts!)
are placed in the basket.

After calibration I ran a series of test fires using progressively higher input pressure up to 100 PSI. The data looks like this:


The main thing to notice is the significant drop in pressure immediately after the valve opens at 1000 ms. The pressure recovers after the valve closes at 3000 ms. This phenomenon is called regulator droop and it affects all self-operated and pilot-operated regulators. Droop is OK as long as we can characterize it and relate it to jet force. We'll use real-time pressure monitoring in the HAPP just like the static fire stand so we'll always know what the jet supply pressure (and therefore force) is at any instant.

The real problem is that the droop pulls the manifold pressure down to about 60 PSI when the regulator is set for 100, thereby limiting the maximum jet force we can achieve. I tried to compensate by increasing the regulator setting as my air compressor goes to 155 PSI. Great idea, but then the limitation of the Festo valve became clear: It won't open when supply pressure is over 100 PSI - not surprising, as the datasheet says it's only rated to 87 PSI. So with this combination of valve and regulator (the regulator on my air compressor), there is no way to deliver 100 PSI to the nozzle.

The other thing to notice is the jet force. When the valve first opens the nozzle sees 100 PSI for an instant. But even then the jet force only achieves 4N versus a design intent of 7N. This is a significant underperformance. As I discussed, the force pad calibration for this setup is highly suspect, so it's best to see some cleaner data before drawing any conclusions.

Round 2

For the next round I used the improved design of nozzle v6. This nozzle has a design intent of 11N at sea level with 100 PSI air supply. I also changed out the solenoid valve and used an AirTAC 4V230C. This valve has a published operating range of 114 PSI and a 3-position, 2-solenoid actuation that might let us go a bit higher. It has a Cv of 0.67, just enough versus our requirement of 0.65, and it was readily available. For future reference, this kind of 5/3-way valve could be used to power the plus and minus jet pairs on a HAPP axis. We'd need two of the 2/2-way Festo valves to accomplish the same (but the Festo pair would still be significantly lighter).

By looking at the photos, the improved calibration method for nozzle v6 should be apparent. I made a nice flat insert to place over the nozzle during calibration and provide a stable surface for adding test mass. This resulted in much more consistent calibration data and presumably more accurate jet force readings.


Test masses for calibration, nozzle v6.
Greatly improved stability & repeatability.

The test fire data looks like this:


Again we see the regulator droop (blue line). But now I've compensated by raising the regulator setting to 155 PSI. We achieve a max jet force of about 8.5N, which is within 22% of the target value. The data sheet for the force pad says that +/- 15% accuracy is normal, so we may in fact be getting close to 11N. There's probably no way to know for sure with the current test apparatus.

In addition, the XY resolution of the 3D printer I used can only guarantee the nozzle throat radius is within +/- 9.6% of nominal. We could be under-achieving on jet force in part due to an under-sized nozzle throat. This could be corrected in the future by designing a nozzle with a throat dimension that corresponds to a standard drill bit size. The throat could be reamed after printing to ensure dimensional accuracy.

Since you've persevered through this post, here's a video of some test firings. It may be difficult to appreciate just how loud the nozzle is. I can also tell you the difference in jet force between using the nozzle and simply letting the air vent out of the pneumatic tube is quite dramatic. The nozzle is definitely trying to do its job.


Poor Boba Fett...
(Song credit: bometheus)


So what have we learned, and what's next? Well, the nozzles appear to be functioning, perhaps even somewhat close to design intent. But we have not characterized the pressure/force relationship with enough accuracy that we can use it in the flight controller software. As we've pushed the limitations of this test setup as far as practicable, we need another, more accurate approach to measuring jet force.

Fortunately there is a method with the potential to give errors as low as 1%. The general strategy will be to measure the inertia tensor of the HAPP (or a simple mockup) and with the inertia tensor known, we can fire some jets and measure the HAPP's angular acceleration. If we know the tensor and the acceleration then we can solve for the jet force. This follows from Euler's rotation equation:


and the fact that the change in angular momentum (H_dot) is equal to the jet force times the moment arm (how far the nozzle is from the HAPP center of gravity). This is a good strategy because eventually we have to measure the tensor anyway - the control software needs it so it can analyze the phase plane trajectories.

Easy to say, but now we need an appropriate test rig for measuring the tensor. Stay tuned!

P.S. Sorry, I slipped an equation into the blog... been trying not to do that :-)

Monday, May 9, 2016

Using an Arduino to collect test fire data (AD conversion)

Change of plan. Previously I said we'd take a look at the static test fire results in this post. Instead I'm going to make a short digression and talk about a few issues related to using the Arduino Mega 2560 as a tool to collect and log sensor data. I decided to use an Arduino because I had one handy and I didn't want to purchase a specialized tool like LabJack. Will the Arduino give satisfactory performance?

After reading on the web about similar attempts by others I had two questions.

First, how fast can the Mega's on-board analog to digital converter (ADC) perform reads across multiple input pins? Recall that we are measuring force and pressure data. In practice that means the Arduino reads one input pin, then the other, and then it loops repeatedly. According to the 2560 microcontroller's datasheet, the program should allow a minimum of 125 microseconds after switching the channel to another pin. This time is necessary for the ADC to stabilize. However, some authors recommend putting a delay of at least 5 milliseconds in between successive pin reads to ensure clean data. That would slow down our data collection significantly. Are the 5 milliseconds really necessary?

Second, how noisy is the data? Will we be able to extract meaningful measurements without significant post-processing?

Answers:

(1) No additional delay is required in the program to allow the ADC to settle between pin reads. I verified this by running trials with a variety of delays between 0 and 7 milliseconds across 3 input pins. The graph below shows readings for one of the three pins. As you can see, there is no visible difference in the noise levels. All of the traces stay within an absolute range of about 0.01V. Including the processing overhead associated with the program, I obtained a loop frequency of 353 Hz for the 0-delay program. So, each pin will be read 353 times per second. I'm guessing that's more than enough for our purposes. Therefore we won't need to mess with more advanced strategies like modifying the prescaler or putting the ADC into freerunning mode and using interrupts (see the datasheet).


ADC performance with different read delays:
Readings for 1 of 3 input pins


(2) The data is surprisingly clean. Below is a sample trace from the pressure transducer during test firings at different input pressure settings. I'll discuss the results later, but for now simply note that the data looks quite tidy.


OK, now we're ready to blow some stuff up...

Sunday, May 8, 2016

Static test fire: Prep and instrumentation

It's almost time to blow some stuff up.

With the control system and software up and running, the 3D-printed nozzles in hand, and the pneumatic system procured, I was ready to set up a static test firing stand and investigate performance of the nozzles. If all went well, I'd validate the nozzle design (was the math correct?) and find out whether I had spec'd out the solenoid valves correctly.

The task during these first test firings was to collect real-time data regarding jet force, gas pressure, and mass flow (the amount of gas being delivered). Although there are more "industrial" tools for collecting data, such as LabJack, I'd already obtained a nice collection of Arduino boards from development of the control system, so I thought it would be economical to use one of those. Arduinos have analog input pins that can be used to read sensor data. These pins can accept input voltages from 0 to 5V, so the transducers should be selected accordingly.

Pressure was the easy one. There are many potential vendors for electronic pressure transducers and most of them allow specification of input voltage, output signal voltage, and the range of pressures over which the transducer is sensitive. I settled on a TDH40-C-0250-03-Q00 from Transducers Direct. This little guy takes an input of 12-36V and 4-20mA, is sensitive to pressures between 0 and 250 PSI, and outputs a signal from 0-5V. It also has a 1/4"NPT threaded connection that will go right into the pressure manifold shown in the last post. Perfect.


Pressure transducer mounted to manifold


Force turned out to be a bit trickier. After brainstorming a few ideas I decided to try and measure force directly using a force sensing resistor pad. These are small, polymer-based pads with some printed circuitry that delivers progressively less resistance as a mechanical load is applied. By using an appropriate voltage divider circuit, the Arduino will see 0-5V on its input pin depending on how much force the pad experiences. I bought a couple of these for the static test fire stand. They are sensitive to 0-20 newtons, which is well within our target range of 11 newtons of jet force.


Force sensitive resistor pad with nozzles
v3 (center) and v6 (right). Note how the
design of v6 was optimized for the force pad.

The idea was to place a pad directly under the nozzle and fire the nozzle upward. The thrust should press the nozzle down onto the pad and we get a voltage reading at the Arduino. Sounds simple, but in practice accuracy is a problem. The main issue is that the pad resistance "drifts" over time with a constant load applied. A longer jet firing will give different readings than a short one, even if the force is identical. Another issue is that the pad must be calibrated with test weights every time something is moved around on the test stand. This is because the nozzles are attached to tubes that flex like springs and affect the force readings (recall Hooke's Law). If the tubes are moved around even slightly the effective spring force will change. After many iterations, I think I'm getting accuracy within +/- 15%, which is not good enough for setting parameters in the controls software, but probably good enough to make a rough assessment of the nozzle design.

Mass flow was the hardest one. I was not able to find an affordable mass flow sensor that could handle the pressure range and high flows anticipated. Pressure will be approximately 100 PSI. The nozzle math (for version 6) says we should expect flow in the range of 1061 liters/min (37.5 ft^3/min) at standard conditions. I did find some relatively inexpensive sensors - around $150 - that operate based off of heat transfer from a heater element directly exposed to the flow stream. One example is this one from Honeywell. However, like the other sensors I found, the Honeywell sensor does not come close to satisfying the pressure or flow rate requirements. There are more "industrial" solutions available but I didn't want to spend a thousand dollars or more on a sensor, especially when we likely can validate the nozzle designs with pressure and force data alone. For now I've left space on the test stand for a mass sensor but have not included one.

With sensors in hand, I wrote a program for an Arduino Mega 2560 to perform fire control, data collection, and logging to a micro SD card. I had an older generation Arduino WiFi shield - not the current WiFi 101 shield - that I picked up to start learning about wireless communication with the board. The older version has a built-in micro SD card slot that I set up for data logging. The program waits for the operator to push a button and then starts the fire test. The test sequence opens an incrementally-indexed file on the SD card for logging, performs a 5-second countdown with audio (buzzer) and visual (LED) cues, starts logging data for 1 second, fires the jet for 2 seconds, and logs data for 1 additional second after firing.

The next task was to set up the power supplies. The Arduino runs off of 5-12V DC, while the pressure transducer and Festo valves require 24V. The force pad takes a 5V input. To satisfy these differing requirements I set up three power buses on the test stand using standard prototyping breadboard sections. Quick, dirty, and effective.

The 9V bus is fed by a wall-plug power supply to ensure relatively steady voltage to the Arduino over hours of test runs - important, as the Arduino supplies 5V for the force pad directly from a pinout, and this voltage must remain constant to ensure consistent calibration. The 5V bus is fed by the Arduino pinout, and the force pad (along with the buzzer and LED) connects to the 5V bus.

The 24V bus is fed by two lithium-polymer (LiPo) battery packs in series, each with nominal 11.1V but reaching over 12V when fully charged - fully within the tolerance range of the valves and pressure transducer. Although I haven't yet computed the total power consumption budget for the HAPP, and can't until the final hardware has been selected, I bought these LiPo packs as potential flight hardware based on a rough guess.

The final preparatory task was to assemble a convenient mounting board for all of this gear. I used the top of an old children's table from Ikea similar to this one and painted it matte grey. With all the items appropriately mounted the completed static test fire rig looked like this:


Completed static test fire rig

Next post: Test fire results

Friday, May 6, 2016

Valves and pneumatics

Custom controls software and flight computer? Check.

3D-printed supersonic gas jet nozzles? Check.

So far it's been a fun ride and I've learned about a host of new topics. I've also managed to upgrade some of my practical engineering skills from 1990 to 2016. Now there's another new topic to learn: Solenoid valves to control the flow of gas to the nozzles. Well, new to me anyway - solenoid valves have been around since 1910.

Thinking about the HAPP, the design requirements for its valves look something like this:

  • Must permit sufficient flow of gas at target pressure (100 PSI) to achieve nominal jet force. Valve flow is usually expressed in terms of a flow coefficient Cv. After doing the math, it looks like we need a Cv of 0.65 or higher for each of the 12 jets, or about 1.3 for a single valve powering 2 jets in tandem.
  • Must permit high frequency actuation (on/off cycles) in the range of 10 per second or higher - remember the "machine gun" effect in the controls simulation?
  • Actuation speed (time to open & time to close) must be as short as possible, in the range of 50 milliseconds or lower. This follows from the actuation frequency requirement.
  • Lowest weight valve we can find that satisfies the first three requirements. Every extra gram is lost altitude when the HAPP flies.
  • Packaging - how the valve is arranged and attached to the HAPP - is secondary. We can engineer around it. Of course, smaller is better.

After many hours browsing through vendor catalogs on the web, I came across a rather unique valve from Festo. The Festo MHJ series valves are lightning-fast with a switch-on time of 1.0ms and a switch-off time of just 0.5ms. That's more than 10 times faster than most solenoids. The MHJ10-S-2,5-QS-6-HF (high flow) version has a Cv of 0.66. The valves are also featherweight at just 47 grams. Typical 2-way, direct-acting soleniod valves can weigh two or three times more. A single 5-way, 3-position valve can have the same functionality as two of the Festos but may weigh 5 times more. Even more compelling, the Festos contain a built-in relay, so we could potentially eliminate the relay board shown in a previous post.

There's just one issue with these valves: Maximum operating pressure is listed as 87 PSI. We need at least 100. However, all the other specs seemed to blow away any other valves I could find, so I thought I'd take a chance that the datasheet is conservative and the valves might actually be able to take 100+. I ordered two for testing.


The two Festo 2/2 valves at right (47g each) have
the same functionality as the 5/3 monster at left (447g)
and are blazing fast


Since we eventually need to connect multiple solenoids with some sort of compressed gas supply, we also need a manifold. I found this little aluminum guy with one inlet port, six outlet ports, and an additional port we can use for a pressure transducer (the flight controller must know actual pressure to the jets in real time so it can estimate instantaneous jet force).


One tidy little manifold

The last major component of the pneumatic system for static fire tests is some sort of compressed gas source. For the flight hardware we'll likely use a lightweight carbon-fiber tank and regulator, like this and this. For the static fire tests it will be inconvenient to repeatedly charge a small tank and we're better off using a common air compressor like the one I had in my garage. It will output 155 PSI, which should be more than enough.

Rounding out the pneumatic system for the static fire tests, I procured some standard 3/8"OD pneumatic tubing and a variety of quick connects.

Now it's time to set up the static fire stand, wire up the instrumentation, and make some noise!

Thursday, May 5, 2016

Inspiration

Following up on yesterday's post about 3D printed nozzles, here's an inspirational photo for the HAPP project. I took this from the window of an airliner at cruising altitude somewhere over Siberia during winter. It's pretty, but in the words of The Great Sly, "I Wanna Take You Higher"...


(c) Christopher Couch 2014


Wednesday, May 4, 2016

Nozzles: Design considerations and initial versions

The business end of a cold gas reaction control system is the nozzle. The HAPP will need twelve of them (see Controls Part 2).

As rocket nozzles tend to be fairly complex shapes with internal cavities, and also as the HAPP nozzles will likely be fairly small, it seems natural to fabricate them using additive manufacturing techniques, a.k.a. 3D printing. 3D printing requires a CAD model of the object to be printed, so again (like I did for the controls simulations) I needed to upgrade my 1990s skill set and learn some modern CAD software.

I started with FreeCAD. It's a fairly easy-to-learn parametric modeling package, and did I mention that it's free? I used FreeCAD for the first two nozzles I printed, but on the recommendation of my local printer, ThingSmiths in Ann Arbor, I switched to Autodesk Fusion 360 for all the subsequent nozzles. Fusion 360 also has the excellent price of $0.00 but is more highly polished and integrated into the cloud. This greatly facilitated sharing of model data with ThingSmiths.

So how do we design a nozzle? The one piece of trivia related to nozzles that I knew before starting the HAPP project is that nozzles are optimized to work at certain altitudes. The best design for operation at sea level is not optimal for use in the vacuum of space. This is one reason why many rockets are staged; the first stage uses low-altitude nozzles, and the upper stage(s) use high-altitude nozzles. We want the HAPP nozzles to be optimized for atmospheric pressure at the balloon apogee, hopefully around 30Km altitude. That will give us the best control where it counts the most: for the high-altitude money shots.

Atmospheric pressure at sea level is about 14.7 PSI. At 30Km it's 0.2 PSI which is almost a space-like vacuum. Because it may be difficult to test the HAPP flight nozzles in operating conditions - that is, unless someone wants to lend me a vacuum chamber! - my general idea went like this. Develop the nozzle design equations and draw some designs that are optimized for various altitudes. Print a few. Test and verify that the performance at sea level - namely the thrust - matches up with the theoretical equations. If everything lines up, we can have confidence in the math and use it to design the high-altitude flight nozzles. So here we go...

The type of nozzle we need is called a converging-diverging nozzle. If designed correctly it can drastically accelerate the gas to many times beyond the speed of sound. The nozzle's shape resembles its name. It takes the gas and squeezes it down through a narrow throat (converging flow), and then it expands the gas until it reaches the nozzle exit (diverging flow). Look at the classic shape in the image of the Saturn V's F-1 engine below: hot gas starts at the top, gets rammed down through the narrow throat, and then expands down through the exit.

"Designed correctly" means a few things. First, the mass flow has to choke at the throat. Gas velocity at that point will be exactly Mach 1. Second, the gas from the throat must be expanded such that gas pressure at the nozzle exit is equal to the ambient atmospheric pressure. Contrary to what you might guess, the gas will not slow down as it expands - it will accelerate tremendously. Third, the curved profile from throat to exit must be of a certain shape and length to enable efficient expansion.


Rocketdyne F-1 engine for the Saturn V.  Beast mode!

The thermodynamics get a little tedious, but I came across some useful summaries from NASA, Robert Braeunig, and Richard Nakka. Also see MIT, Purdue, and Georgia Tech. Follow those links if you're interested in the math.

In short, my design process went like this:

  • Choose operating conditions - altitude, gas composition, temperature, supply pressure from tank. The final design will target an altitude of 30Km using N2 or helium gas at 100 PSI. We'll probably use a thermal blanket inside the HAPP to protect batteries and electronics, so assume temp is 20C.
  • Choose desired thrust force. 11 newtons is a good target based on the controls simulation. With my best guess at the HAPP's inertia tensor (having not yet designed it!), 11N should settle the HAPP out of a hard spin in about 3-4 seconds. If that's over-powered for fine stabilization, we'll have to scale things down later.
  • Solve for primary nozzle parameters - throat radius, exit radius, nozzle length.
  • Apply the nozzle contour method published in 1958 by G. V. R. Rao, one of those Project Mercury-era badasses with a slide rule. Mad respect for that generation of engineers.
  • Render the completed nozzle contour into a solid object for 3D printing.

Below are a few of the design iterations. Version 1 is a high-altitude nozzle designed to produce 11 newtons of thrust using air supplied at 100 PSI. In the photo (not the CAD), notice the threads tapped into the top of the chamber inlet. This was to enable insertion of a threaded tube connector. It's a reasonable design, but I cracked the first printing when I over-torqued the connector. Also notice the tessellation (little "triangles") inside the chamber and nozzle. This is due to my not knowing I could specify a finer-resolution mesh when exporting the data for 3D printing; it wasn't immediately obvious in FreeCAD.


Test nozzle v1

Oopsie

Version 3 is a low-altitude nozzle for 7N thrust using air at 100 PSI. Note the extended inlet tube. This enables use of a threadless quick-connect for the supply tube - thanks to the Oregon State team for sharing this idea via email! Also note how I mounted it on a pusher plate so I can place on a force-sensitive resistor pad and measure jet force during static test firing. This is a converging-diverging nozzle; you can just barely see the narrow throat a few millimeters back from the exit.


Test nozzle v3

Version 6 is a low-altitude nozzle for 11N thrust using air at 100 PSI.  Again there is a quick-connect tube. But now the nozzle base has been optimized to sit directly on the force resistor pad. It's far too bulky to serve as flight hardware, but I'm sure I'll be printing a few more design revs before launch :-) Some cool statistics: The math says this nozzle should have an exit velocity of Mach 1.9 and a mass flow rate of 22.9 grams of air per second. It really blows!


Test nozzle v6

So we have one nozzle for high-altitude operating conditions (v1) which we can only test at low altitude, and two different design intents for low altitude (v3 and v6). In the near future I may add a nozzle that's optimized for helium instead of air or N2; it can potentially produce higher thrust, and I may use helium for the reaction gas instead of air as we'll have lots of helium on-hand when we fill the weather balloon on flight day. With this collection of nozzles, we can physically test the validity of the math over a variety of conditions and have confidence the flight versions will work as predicted.

Finally, regarding the 3D printing - these nozzles were printed on a modified Formlabs Form1+ SLA printer with 25-micron resolution. The material is Formlabs Clear methacrylate photopolymer.

Next post: Figuring out the pneumatic system and solenoid valves...